

Many people are surprised when they learn how mortgage interest rates are determined.
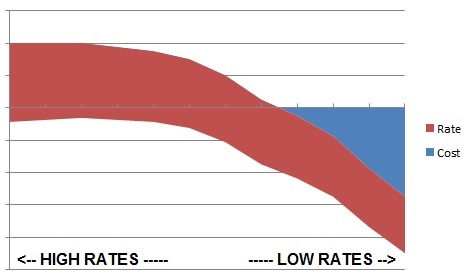
Plenty of people understand the crucial principle: the lowest interest rates cost more to obtain, and the higher interest rates cost less. The graph above illustrates how you can obtain rates with “no real costs” (which is often offset by the lender offering the loan). But when analyzed with lower rates, closing costs must be paid by the borrower or an allowable 3rd party (for example, the home seller).
The interest rate offered is essentially not determined merely by the bank or brokerage where you apply for your mortgage. Instead, banks and brokers attempt to pin down your interest rate for a long enough time to close your transaction, and at cost//fee and interest rate circumstances that have been revealed to you in writing.
The following graph displays the variety of interest rates presented from 2008 through late 2013.
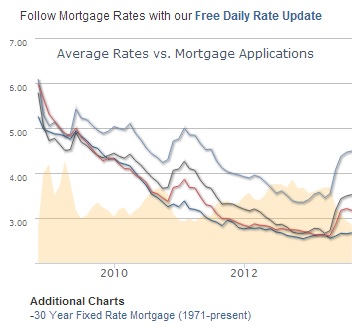
Our free daily interest rates news can be sent to you by subscribing at: http://www.mortgagenewsdaily.com/mortgage_rates/#{uname=daveboye}
You can also bookmark this link to view interest rates news on your own at any time.
Interest rates are acquired for bank and broker clients by obtaining the loan funds through four major categories of mortgage investment sources (most are publicly traded, Mortgage Backed Securities- MBS):
- Conventional Loans – Funded by Fannie Mae or Freddie Mac (financial trading devices: FNMA and FHLMC)
- Government-Backed Loans – FHA, VA, and USDA mortgages (financial trading devices: GNMA)
- Jumbo Mortgages – Alternatively called “portfolio mortgages,” with pricing influenced in part by major indices such as LIBOR
- In-House Mortgages – Offered directly by local banks or credit unions, based on their borrowing costs
For FNMA, FHLMC, and GNMA-backed securities, representing the majority of mortgages in the U.S., these financial instruments behave much like stocks. Their prices change constantly in response to movements in major financial markets. This means the interest rate you’re offered can fluctuate until you lock it in.
Below is a graph showing market activity for the FNMA 4.0% 30-year security on September 30, 2013, illustrating how rates can shift over a single day.
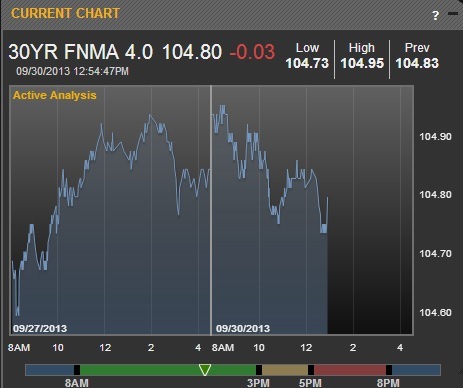
From this, you can tell the price of the Mortgage-Backed Security (MBS) is progressing by the minute.
(Note: In-house and portfolio lending interest rates tend to change less often, but they are always subject to change at any moment as major indices move.)
When applying for a mortgage, the banks and brokers offering loans will usually issue pricing for various interest rates that change as little as once per day, and on a volatile day in the market, could change as many as three times in one day. This may happen up until your interest rate is “locked in.”
From the MBS illustration above, investors traded the FNMA 4.0% 30-year security on 9/30 with a 480 basis point (BPS) spread between its actual market value and the literal cost of the security. In other words, “behind the scenes,” 4.8% of the MBS’s value was being leveraged to invest in a 4.0% security available for mortgages. On a $100,000 investment or mortgage, this equates to $4,800 being exchanged in the background.
On 9/30/13, the interest rate offered by most investors was higher than that of the 4.0% MBS security. In practical terms, one of our mortgage investors would determine the day’s mortgage rate using this instrument alongside other, often blending 4.0% and 4.5% MBS securities, while factoring in their internal costs.
On that day, the national average 30-year interest rate was 4.28%. One investor’s rate sheet showed that locking in a 4.25% interest rate for 30 days would allow 1.670% of the loan amount to be applied toward the borrower’s settlement costs (covering expenses like mortgage broker fees, title insurance, closing costs, appraisal fees, hazard insurance premiums, and taxes). On a $100,000 loan, that would amount to $1,670 in credits toward these expenses.
(See the chart below for interest rates and “cost of rates” as a percentage of the loan amount.)
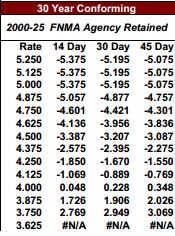
There is a clear cost-versus-interest-rate relationship for every 0.125% change in rate offered by each mortgage investor at any given moment. At Black Diamond Mortgage Corporation, we share our borrowers’ actual investor rate sheets, along with any “adjustments” for credit scores, loan sizes, or other risk factors, so they can make an informed choice. We help them compare the lowest interest rate to the lowest cost mortgage, factoring in any maximum rebate available.
When we talk about “adjustments,” we mean that better credit scores and homes with equity generally qualify for better rates. If a loan falls outside an investor’s ideal parameters, they may still approve it but will apply “cost adjustments” to offset the perceived added risk.
It’s worth noting that retail mortgage banks and traditional banks rarely disclose how much they earn after selling a mortgage. But as seen in the 4.0% FNMA security trading on 9/30/13, when the national average 30-year rate was 4.28%, there can be significant amounts of “behind-the-scenes” money in play. While we can’t control those market trades, we always disclose exactly how much our firm retains, whether through lender-paid or borrower-paid compensation.
To fully understand your loan terms, request written disclosures from your bank or broker. This is also the time to confirm your “lock terms” to ensure costs and rates won’t change unexpectedly. Most banks require a loan application before giving a bona fide proposal, as rates and fees depend on your specific loan details.
Without an application, asking for a mortgage rate is like asking, “How much does it cost to build a bridge?” The answer depends on many unique variables.
I imagine if you read this far, you have more questions than answers. Please contact us directly to answer all your questions, or if you want to see the terms you would receive, just apply for a loan today on our website.


